Ctrl+K

🖼️ Sphinx-Gallery

Site Navigation

  • User guide
  • Advanced
  • Demo galleries
  • Changelog

Site Navigation

  • User guide
  • Advanced
  • Demo galleries
  • Changelog

Section Navigation

  • Matplotlib Gallery (and basics)
    • Local module
    • Introductory example - Plotting sin
    • Plotting the exponential function
    • Seaborn example
    • Capturing output representations
    • Choosing the thumbnail figure
    • Providing a figure for the thumbnail image
    • Using Unicode everywhere 🤗
    • Identifying function names in a script
    • Using sys.argv in examples
    • Matplotlib animation support
    • A short Python script
    • Example that fails to execute
    • Constrained Text output frame
    • SyntaxError
  • Notebook-style Narrative Gallery
    • Alternating text and code
  • Mayavi Gallery
    • Plotting simple 3D graph with Mayavi
  • Plotly Gallery
    • Example with the plotly graphing library
  • PyVista Gallery
    • Collision
    • Plotting Glyphs (Vectors or PolyData)
    • Lighting Properties
    • Ray Tracing
  • Example Galleries
  • PyVista Gallery

PyVista Gallery#

PyVista Examples#

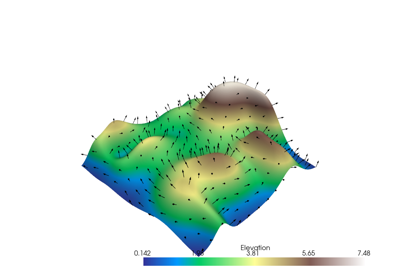
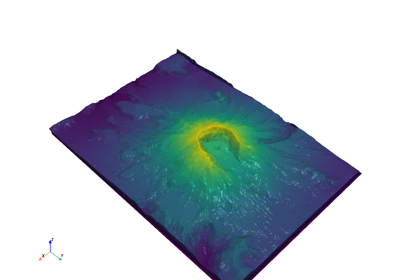
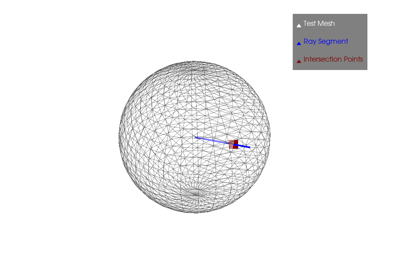
Examples from the Sphinx-Gallery using PyVista for embedding 3D plots. Learn more about PyVista and see their extensive examples gallery built with Sphinx-Gallery!

Take a look at the Image scrapers section to learn more about how to enable and use PyVista in your example gallery.

Collision

Collision

Plotting Glyphs (Vectors or PolyData)

Plotting Glyphs (Vectors or PolyData)

Lighting Properties

Lighting Properties

Ray Tracing

Ray Tracing

Download all examples in Python source code: auto_pyvista_examples_python.zip

Download all examples in Jupyter notebooks: auto_pyvista_examples_jupyter.zip

Gallery generated by Sphinx-Gallery

previous

Example with the plotly graphing library

next

Collision

On this page
  • PyVista Examples

© Copyright 2014-2023, Sphinx-gallery developers.

Created using Sphinx 6.1.3.

Built with the PyData Sphinx Theme 0.13.1.