Note
Go to the end to download the full example code or to run this example in your browser via JupyterLite or Binder.
Choosing the thumbnail figure#
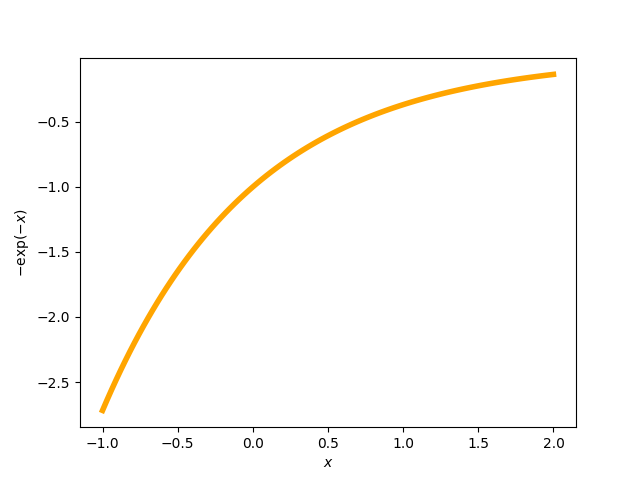
This example demonstrates how to choose the figure that is displayed as the
thumbnail, if the example generates more than one figure. This is done by
specifying the keyword-value pair
sphinx_gallery_thumbnail_number = <fig number> as a
comment somewhere below the docstring in the example file. In this example, we
specify that we wish for the second figure to be the thumbnail.
# Code source: Óscar Nájera
# License: BSD 3 clause
# sphinx_gallery_tags = ["matplotlib","line-plot","thumbnails"]
import matplotlib.pyplot as plt
import numpy as np
def main():
"""Plot expoential functions."""
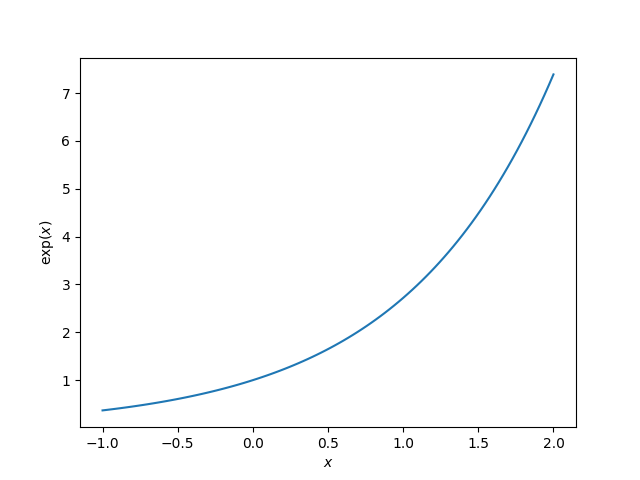
x = np.linspace(-1, 2, 100)
y = np.exp(x)
plt.figure()
plt.plot(x, y)
plt.xlabel("$x$")
plt.ylabel(r"$\exp(x)$")
# The next line sets the thumbnail for the second figure in the gallery
# (plot with negative exponential in orange)
# sphinx_gallery_thumbnail_number = 2
plt.figure()
plt.plot(x, -np.exp(-x), color="orange", linewidth=4)
plt.xlabel("$x$")
plt.ylabel(r"$-\exp(-x)$")
# To avoid matplotlib text output
plt.show()
if __name__ == "__main__":
main()
Total running time of the script: (0 minutes 0.691 seconds)
Estimated memory usage: 231 MB