Note
Go to the end to download the full example code or to run this example in your browser via JupyterLite or Binder.
Providing a figure for the thumbnail image#
This example demonstrates how to provide a figure that is displayed as the
thumbnail. This is done by specifying the keyword-value pair
sphinx_gallery_thumbnail_path = 'fig path' as a comment somewhere below the
docstring in the example file. In this example, we specify that we wish the
figure demo.png in the folder _static to be used for the thumbnail.
Note, the path to the image should be relative to the conf.py.
# sphinx_gallery_tags = ["matplotlib","line-plot","multiple-figures"]

import matplotlib.pyplot as plt
import numpy as np

# sphinx_gallery_thumbnail_path = '_static/demo.png'
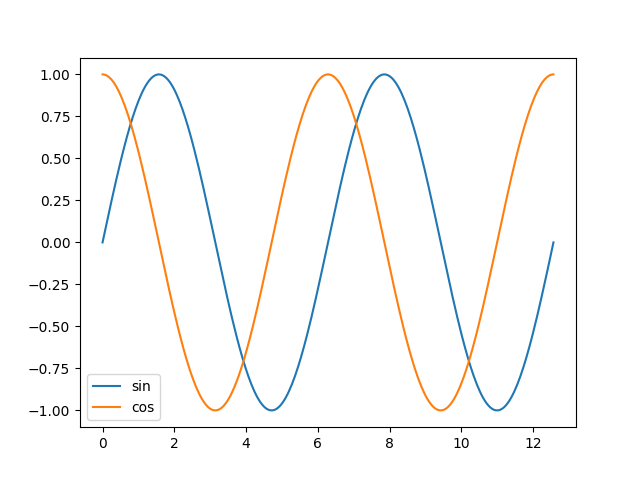
Plot 1#
plt.figure()
plt.plot(x, y1, label="sin")
plt.plot(x, y2, label="cos")
plt.legend()
plt.show()
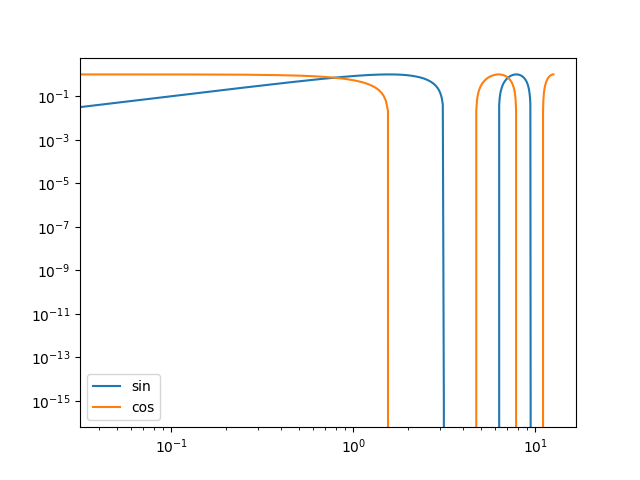
Plot 2#
plt.figure()
plt.plot(x, y1, label="sin")
plt.plot(x, y2, label="cos")
plt.legend()
plt.xscale("log")
plt.yscale("log")
plt.show()
Total running time of the script: (0 minutes 1.495 seconds)
Estimated memory usage: 194 MB